
How good should we expect seismic hazard maps to be?
A team of researchers from the Observatory, in collaboration with the Northwestern University (USA), just published a new study about the theoretical performance of seismic hazard maps in « Scientific Reports ». This study illustrates the difficulty of evaluating the quality of these maps, particularly in stable zones where earthquakes are rare.
What is a seismic hazard map?
Hazard maps “predict” the level of ground shaking due to earthquakes that should be exceeded with a certain probability over a given time (conventionally 10% probability in 50 years). For 50 years, seismologists have provided society with seismic hazard maps, which are for example used as inputs to codes for earthquake-resistant construction.
The limitations of seismic hazard maps
Recent large earthquakes that caused stronger shaking than expected (e.g., 2010 Haiti, 2011 Tohoku) have generated debate about how well probabilistic hazard maps actually perform. Some seismologists argue that the method is flawed, according to others the method is fine but the maps are biased by incorrect parameters, while a third opinion considers these cases as low-probability events that need not be inconsistent with the map.
Compared to meteorological forecasts, it is much more difficult to evaluate the performance of seismic hazard maps. This is a consequence of the rare occurrence of earthquakes. To gain more insight in this issue, researchers from ROB collaborated with Northwestern University to conduct a simulation experiment.
Strong variability between the simulations
In this experiment, simulated ground motions are compared with hazard maps generated for the same hypothetical seismicity models. The mean of the simulations is in good agreement with the expectation (the probability considered in the hazard map), suggesting that the probabilistic method is internally consistent. However, the variability among different simulations appears to be very large, which limits our ability to assess whether misfit between a hazard map and actual shaking is accidental or due to a biased map. Our results also show that this is more problematic for stable continents characterized by low seismic activity (such as NW Europe) than for more active regions like plate boundaries (e.g., California, Japan). As a result, it is almost impossible to check the validity of hazard maps for stable continents based on the short record of observed seismicity that is currently available, whereas it may be possible for plate boundaries. Hence, debate about the utility of seismic hazard maps will likely continue.
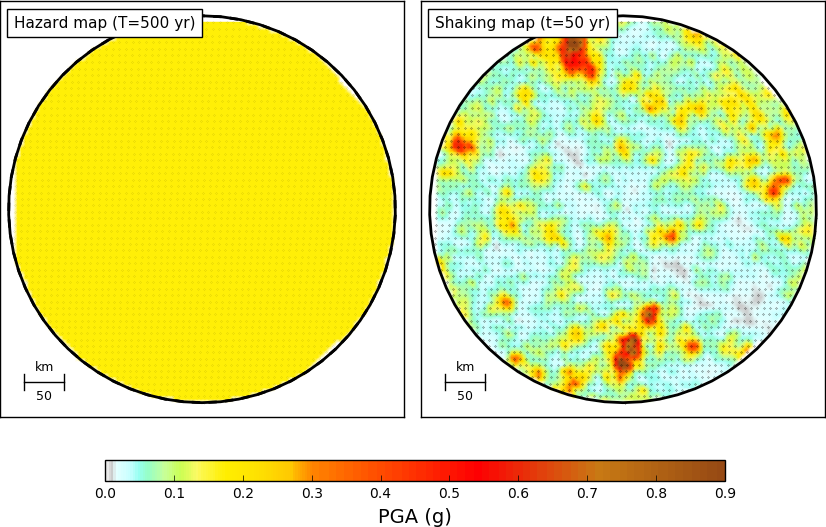
Comparison between a hazard map (10% probability for exceeding a given level of ground shaking in 50 years, left) and a map with simulated shaking over a period of 50 years (right). Both are representative of a hypothetical area with uniform seismicity at a level similar to a plate boundary. On average, the simulated shaking exceeds the hazard map in 10% of the area, but this percentage varies strongly between different simulations.
Reference:
Vanneste, K. et al., “Insights into earthquake hazard map performance from shaking history simulations”, Scientific Reports, volume 8, Article number: 1855 (2018), online. doi:10.1038/s41598-018-20214-6. https://www.nature.com/articles/s41598-018-20214-6