
The largest pluviometer in Belgium? A gravimeter!
For the first time, scientists from the Royal Observatory of Belgium and the Royal Meteorological Institute compare the data of a meteorological radar with those of a gravimeter, which measures changes in gravity. In a joint study published in the journal Hydrology and Earth System Sciences, they showed that a superconducting gravimeter detects precipitation as a giant rain gauge over a 400 m radius. This instrument is a new source of in-situ observations to validate precipitation observations from weather radars and meteorological satellites.
Levitating in a magnetic field for more than 23 years, a metallic sphere as large as a ping-pong ball detects the slightest variations in gravity at a depth of 48 m, under the High Fens plateau. 85 km away, in the province of Luxembourg, a 7-meter diameter sphere standing at the top of a 46-meter tower houses a parabolic antenna that constantly sweeps the horizon and has been observing rainfall within a 250-km radius for over 17 years. These two instruments, the superconducting gravimeter of the Royal Observatory of Belgium and the Wideumont radar of the Royal Meteorological Institute, are the basis of a surprising study carried out jointly by the two institutes.
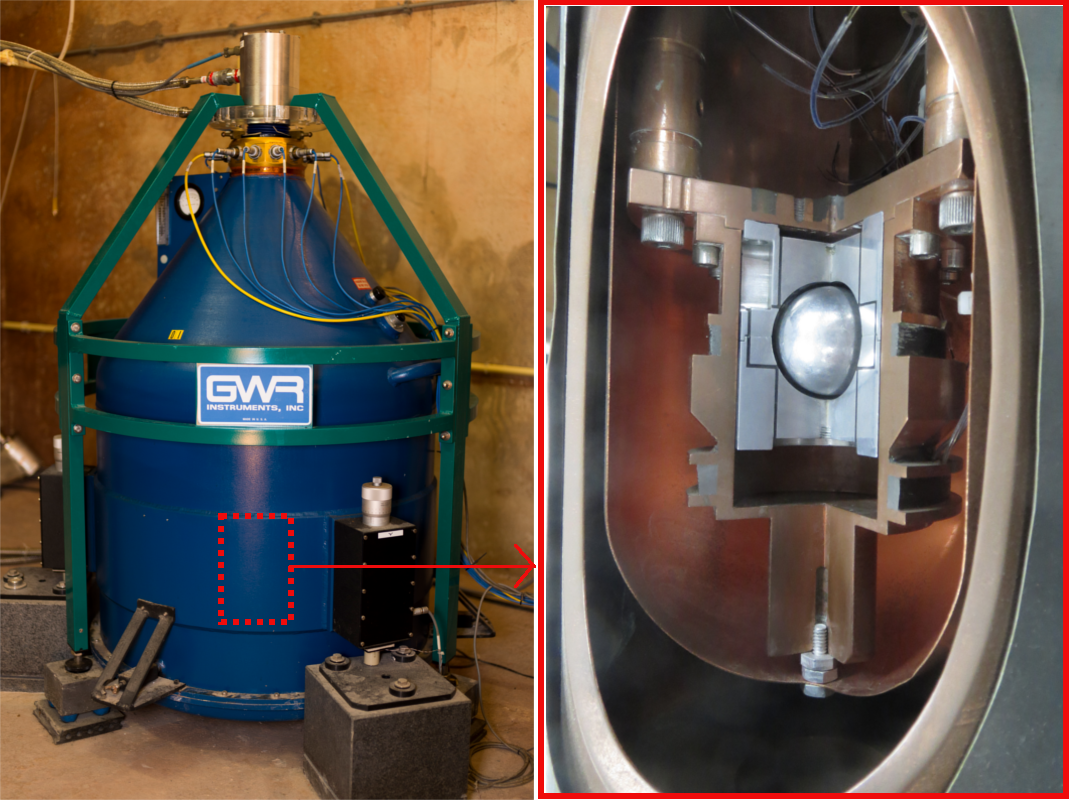
Left: The superconducting gravimeter of Membach. Right: Detail drawing of the sensor with the levitating sphere. Left picture: E. Coveliers
In Belgium, gravity (g) has a value close to 9.81 m/s². This value is essentially due to the gravitational attraction of the Earth. However, it is not constant. Small variations are caused by tidal forces, caused by the relative movements of the Sun and the Moon. Climate-related variations are also observed. The amount of water in the soil varies over the seasons. During the winter, well-filled aquifers increase the Earth’s mass and increase surface gravity. These variations, of the order of one billionth of g, are extremely small but are measured by the gravimeter. Geophysicists have long known that precipitation, by feeding water reservoirs in the ground, influences gravity. However, there has been only a few studies of the impact on gravity of very intense precipitations, rain or hail, produced in a few minutes by severe thunderstorms. Never before had the measurements of a gravimeter been compared to those of a meteorological radar.
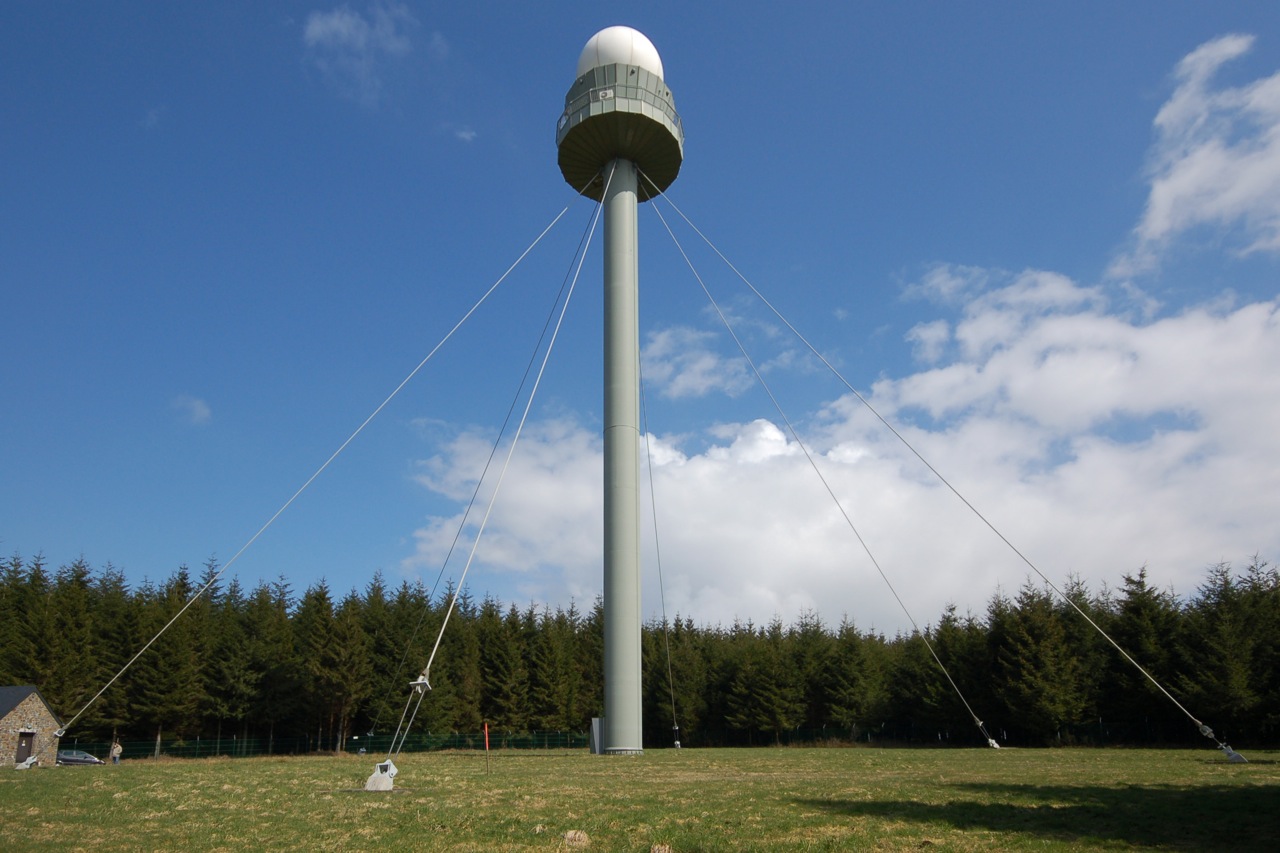
The weather radar of Wideumont
The radar remotely detects precipitation by emitting electromagnetic waves. Echoes from drops, hail or snowflakes are used to estimate the intensity of precipitation. The Wideumont radar, combined with the other radars covering Belgium, provides an overview of precipitation every 5 minutes.
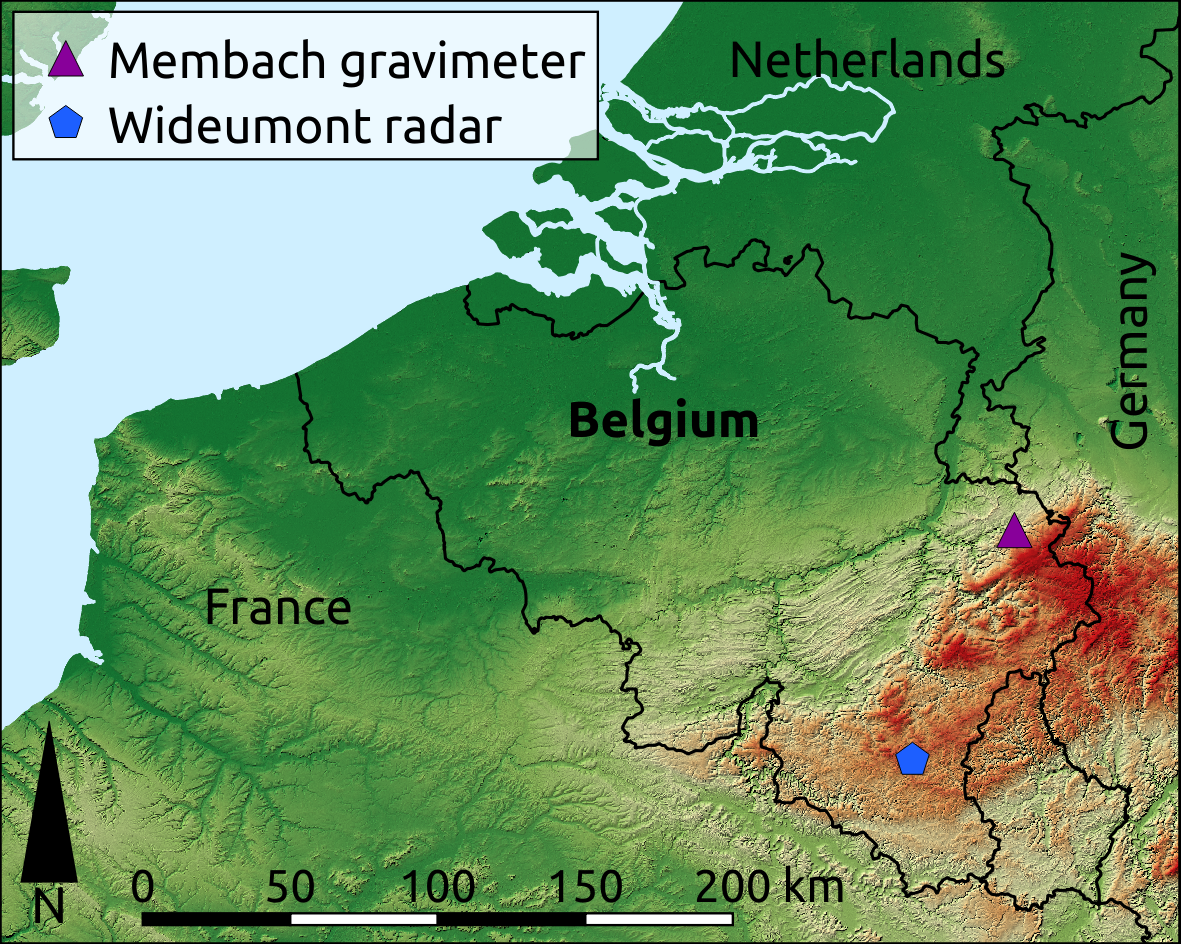
Radar and gravimeter location
The following radar animation shows a stormy episode that hit Belgium on July 24, 2017. The black cross indicates the position of the Membach gravimeter. Between 13:00 and 14:00, the radar observed very intense precipitation above the underground gravimeter.

The figure below shows the evolution of gravity measured by the gravimeter and the intensity of precipitation estimated by the radar during the day. As the storm passes, the gravity decreases rapidly. Why? Simply because precipitation accumulates at the surface and increases the mass above the underground gravimeter, exerting a counter-gravity. Variations in gravity literally make it possible to weigh the accumulated mass of water and therefore the amount of precipitation. The figure evidences a nice agreement between the cumulative precipitation over the day (22 mm of water in total), estimated by the gravimeter and the radar. These results show that rain and hail are not without gravity!
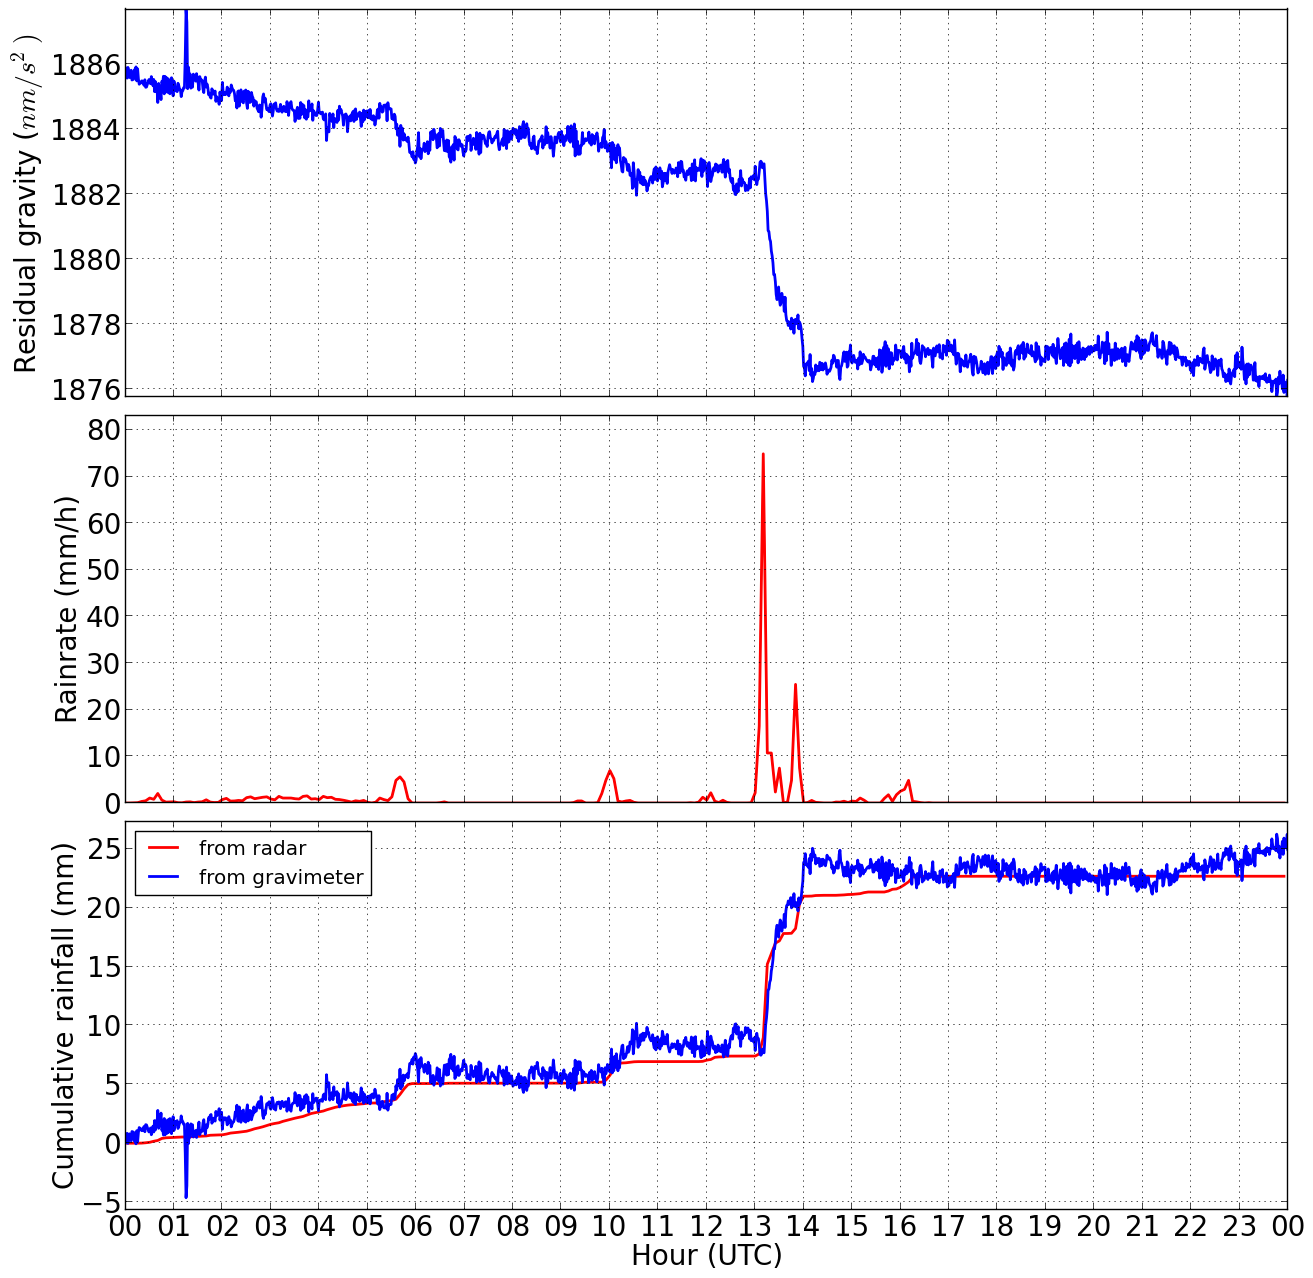
This figure shows the evolution of the gravity measured at Membach (top), the intensity of precipitation estimated by the radar (middle) and the cumulative amount of precipitation (bottom) on 24 July 2017. The cumulative precipitation estimated from the gravimeter and radar appears in blue and red respectively. Although their measurement principles are very different, the estimates obtained from the two instruments are remarkably consistent
Data from both instruments were analyzed over the period 2003-2017 and more than 500 episodes of intense precipitation were identified. The results show that the gravimeter is valuable for estimating the amount of precipitation accumulated over a large area. Indeed, like a gigantic rain gauge, it captures precipitation within a 400 m radius. Directly sensitive to the mass of precipitation, the gravimeter also has the advantage of detecting rain, hail or snow. This instrument is, therefore, an interesting new source for in situ observations to validate precipitation observations from remote sensing instruments such as radars and meteorological satellites. Precipitation measurement is essential for monitoring and refining weather forecasts and for studying the impact of climate change on the hydrological cycle.
The results of this research were recently published in the journal Hydrology and Earth System Sciences of the European Geosciences Union (Delobbe, L., Watlet, A., Wilfert, S., Van Camp, M., Exploring the use of underground gravity monitoring to evaluate radar estimates of heavy rainfall, Hydrology and Earth System Sciences vol. 23 pp. 93-105 (2019). 10.5194/hess-23-93-2019.)
More information:
- The research article: https://www.hydrol-earth-syst-sci.net/23/93/2019/hess-23-93-2019.html
- An article about the the gravimeter of Membach published in EOS magazine
- An article about the the gravimeter of Membach published in Daily Science (in French)
- The weather radar
- Real-time radar images on the website or on the RMI smartphone application (in French or in Dutch)