
Belgian astronomers help to compile the most detailed 3D map of our Galaxy ever made
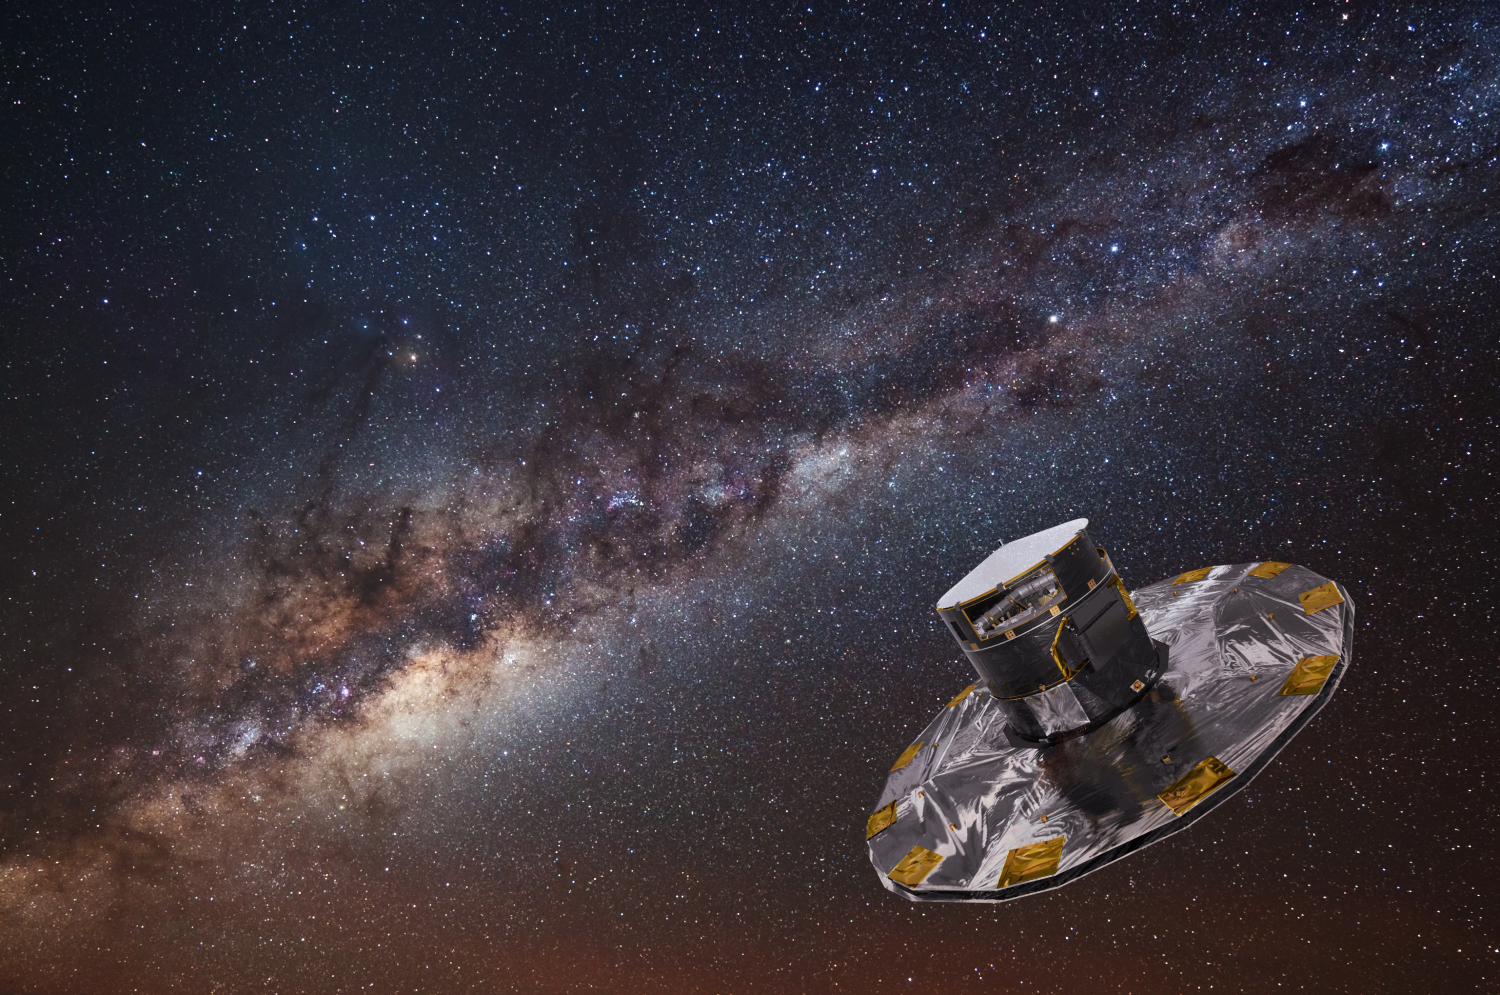
On 25 April 2018, the European Space Agency (ESA) announces the largest and most accurate 3-dimensional map of our Milky Way galaxy ever made. Using the Gaia satellite, the position and motion of more than a billion stars was mapped by a consortium of European astronomers, including scientists from the Royal Observatory of Belgium. This map will be a treasure chest to discover the structure, the history, and the future of our Milky Way Galaxy.
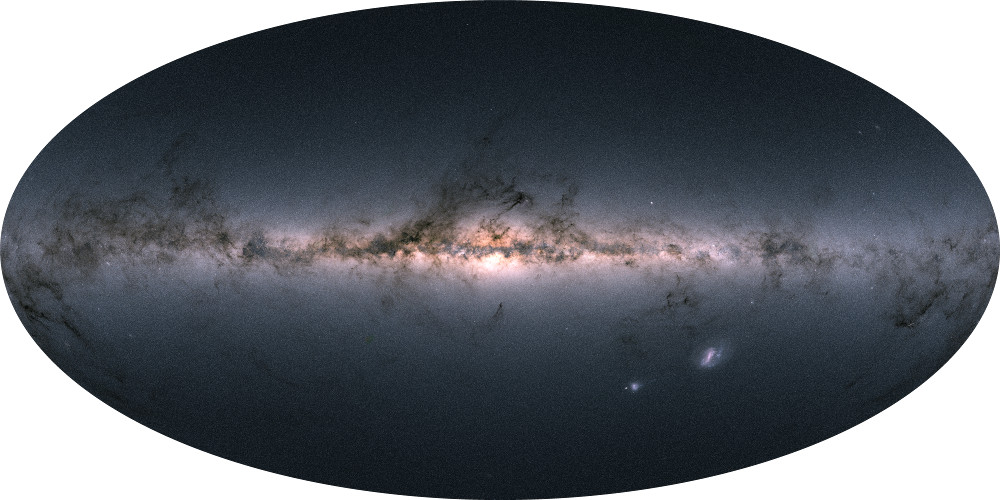
First Gaia skymap in colour. Credits: ESA/Gaia/DPAC, A. Moitinho / A. F. Silva / M. Barros / C. Barata, University of Lisbon, Portugal; H. Savietto, Fork Research, Portugal.
The Gaia satellite has been charting the sky since 2014, and its map includes stars that are a million times fainter than what can be seen with the naked eye. Exceptional to the present Gaia’s map is that it also includes the distances to the stars, making it a gigantic 3-dimensional atlas. Gaia’s map also contains measures of how fast and in which direction the stars move through space as they orbit the galactic center, enabling astronomers to study the rotation of our Galaxy.
The Royal Observatory of Belgium (ROB) have made a significant contribution to the Gaia project by calculating one important aspect of the star movement: how fast the star is moving in our direction or away from us. This is what scientists called the “radial velocity of the stars”. The radial velocity of a star is measured using the Doppler effect. A star moving away from us will have its light slightly shifted towards the red, while a star moving towards us will have its light slightly shifted towards the blue. Using the Radial Velocity Spectrometer, we can determine this shift and thus measure the movement of the star in our direction.
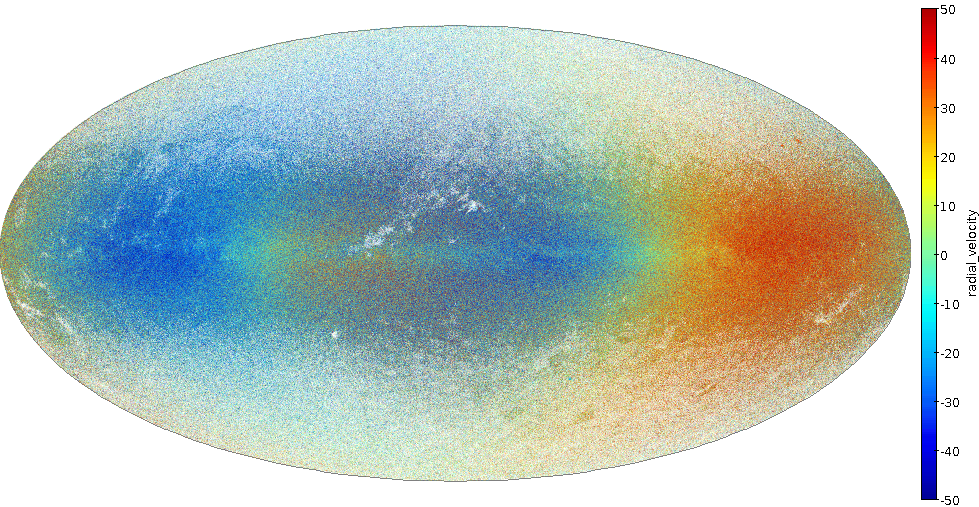
Image caption: Radial velocity distribution of more than seven million of stars with data collected by the ESA Gaia satellite and published in the present Gaia catalog. The blue colors show stars which move toward us. The red and green colors show stars which move away from us. Those radial velocities are the consequence of the movement of the Sun between the stars and of the rotation of stars around the center of our galaxy, the Milky Way. (Image credit: A. Lobel/ESA/Gaia/DPAC)
By processing data from the Radial Velocity Spectrometer, an instrument onboard the Gaia satellite, Gaia scientists have computed the radial velocities of more than 7 million stars, data that are published for the first time on this day. With such information about star positions and velocities, astronomers can track back the journey of each of these stars over the past million years, and predict where they will be going in the future. Hence, they can predict how the shape of the constellations in the night sky will slowly change in time. “This will ultimately lead to a better understanding of the structure and formation history of our Galaxy”, says Dr. Ronny Blomme, project investigator of the Gaia ROB team.
ROB also contributes to data processing related to asteroids. Amateur astronomers have long been waiting for asteroid data in Gaia. When observing an occultation of a star by an asteroid, by using the times of disappearance and reappearance of the star for different observers along the occultation path, one can reconstruct the size and the shape of the asteroid. However, until now for many asteroids it was quite difficult to predict where the occultation would be visible. The occultation path has a typical width of a few tens to 100 km, but the uncertainty on the position of the path on Earth could be a few hundred kilometers.
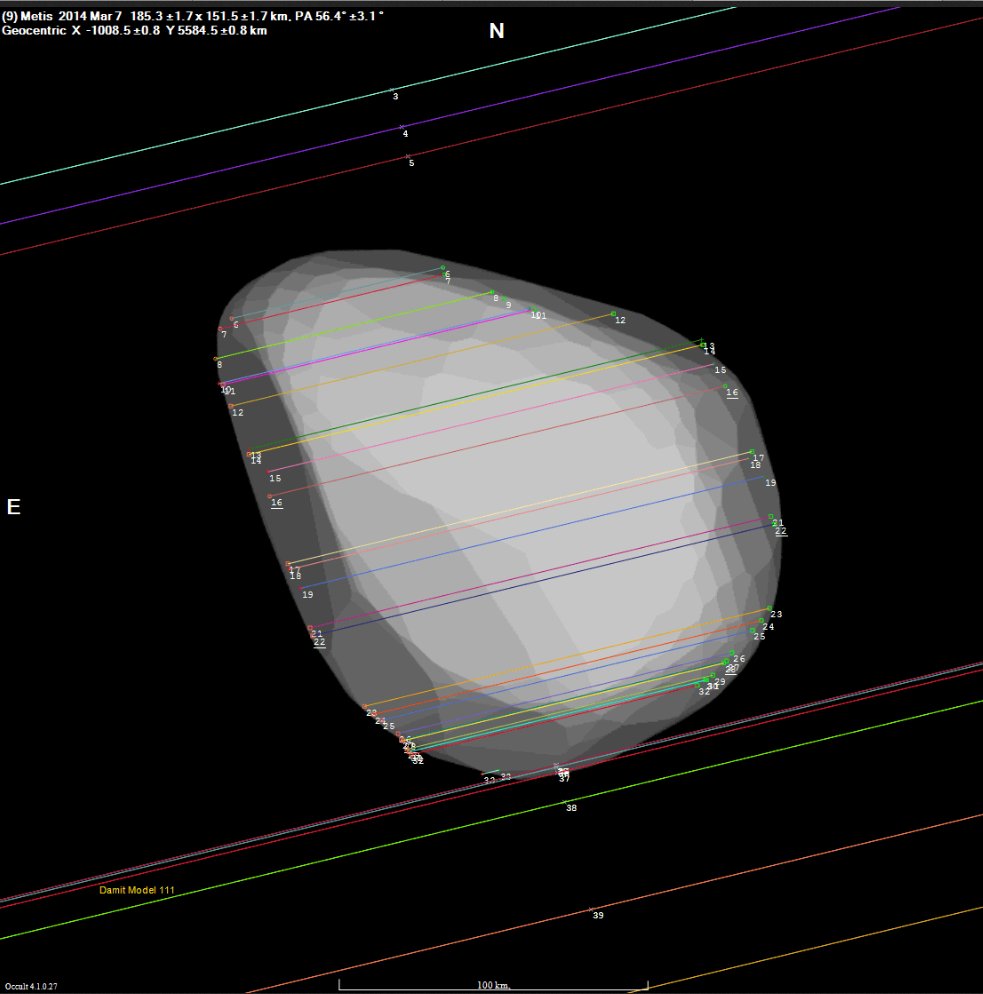
Image caption: An example of reconstruction of the shape of Metis, using the timings of disappearance and reappearance of an occulted star from some 40 different observers. Until now this was only possible for the brightest and very well-known asteroids. With the Gaia data such observing campaigns will be organized much more efficiently. (Credit: T. Pauwels)
As a result, amateurs had to observe many possible events, and had only occasionally a positive event. With the Gaia data, in the best cases the uncertainty on the path location can be reduced to 1 km or less, and mobile observers will know exactly where to travel to observe the occultation, while fixed observers will know in advance which occultation will be visible from their observatory and which not, and be much more efficient in their observations.
The present Gaia release contains the precise position of more than 14 000 asteroids, which is about 5 % of the total number observed by Gaia, and which is in turn roughly half of the known population of asteroids. “We are delighted”, says Dr. Thierry Pauwels, which works on the software designed to process Gaia solar system object data. “This is the first time our contribution to the Gaia project is made public.”
Astronomers had to wait for nearly 20 years for this breakthrough in mapping our Milky Way. The Gaia mission will continue to gather data until 2022, when the completed Gaia catalogue will be published, but now scientists have at their hands a magnificent atlas unsurpassed both in quality and quantity, which undoubtedly will lead to many discoveries.
Gaia’s map is be richly annotated with detailed information about the stars such as surface temperature, chemical composition, possibly brightness variations in time, or whether the star moves around another star. Also objects which are in fact not stars at all but asteroids in our own solar system, or bright objects far outside our galaxy are hidden in the measurements and will be part of Gaia’s legacy. Such analysis of Gaia data requires specialized expertise. In addition to the Royal Observatory of Belgium, Belgian astronomers from KU Leuven, Université libre de Bruxelles, Université de Liège and Universiteit Antwerpen contributed to the data processing. The Belgian participation to the Gaia mission has been made possible through funding provided by the Belgian Federal Science Policy Office (BELSPO) via the PRODEX Programme of ESA.
Links:
Visualizing the Gaia DR2 data with Gaia sky: https://www.cosmos.esa.int/web/gaia/gaiadr2_gaiasky
ESA Gaia media kit: http://sci.esa.int/gaia/60174-media-kit-for-gaia-data-release-2/
This news was based on a joint press release from the Royal Observatory of Belgium, KU Leuven, ULB, ULiege and Universiteit Antwerpen.
Communication contact:
Dr. Le Binh San PHAM
Collaborator in communication
Royal Observatory of Belgium
3 avenue Circulaire/Ringlaan
1180 Brussels
lebinhsan.pham @ oma.be
+32 (0) 23730303