
History of the International Center for Earth Tides (ICET)
“The Smurfs at the Royal Observatory of Belgium”
Texts prepared by Prof. B.Ducarme, Prof. P. Pâquet and Prof. M.van Ruymbeke
Topic 1 – Introduction
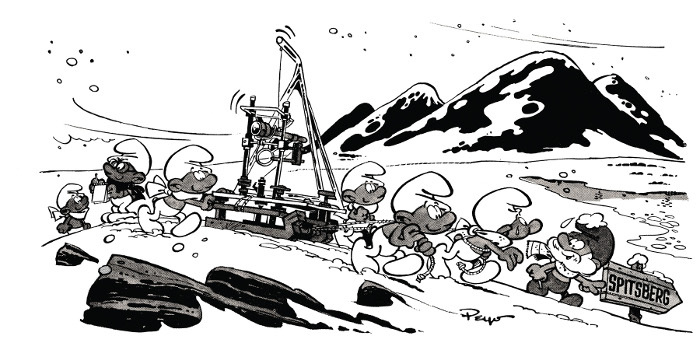
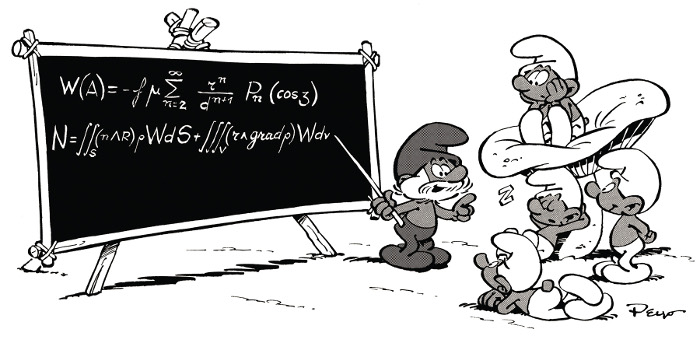
Paul Melchior enjoyed human relations. When King Baldwin granted him the title of “baron” in 1994, he chose as motto “in Omnibus Terris Amicus”. It is not surprising that he became a friend of the cartoonist Pierre Culliford, better known under the pseudonym of “Peyo”, who was living close to him in Ukkel. His personal relations with “Peyo” lead to the original project of making use of the Smurf characters to illustrate the ongoing geodynamical researches. By late 1966 the “International Centre for Earth Tides”, managed by Paul Melchior, sent the first “Smurf” greeting card. Thanks to this collaboration a series of 18 greeting cards were created, through which the little blue men followed the members of the team of the Royal Observatory in all their scientific adventures. Since the beginning our little Smurfs expressed a mighty appetite for Geodynamics to the great displeasure of papa Smurf, but they were also able to convert to studious pupils of the most advanced theories. They had to face the cold of the far North, but they could also rest on paradisiac beaches and visit exotic countries.
The research program of Paul Melchior was clearly defined since 1956:
- Development of a network of permanent stations to record Earth tides phenomena;
- Development of new and ultrasensitive instruments;
- Development of the calibration techniques for these instruments;
- Development of analysis methods for the recorded signals making the best of the fast development of the computers;
- Study of the indirect effects triggered by the oceanic tides on the recorded signal.
Topic 2 – The tidal waves
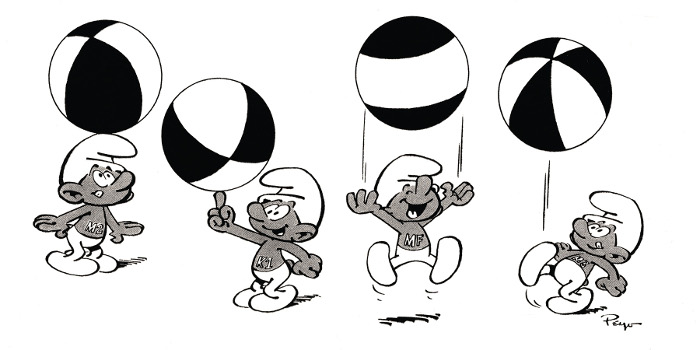
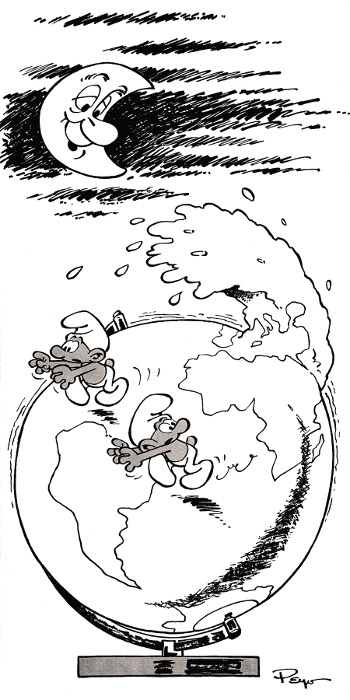
In any point of the Earth the tidal force can be expressed as the difference between the gravitational attraction of the perturbing body in that point and the same force acting at the center of the Earth. Two third of the tidal force is produced by the Moon and one third by the Sun. At the full and new moon the attractive forces of the two celestial bodies are summing up, while the forces are subtracting from each other at the first and last quarter moon (4.a). The tidal range is thus changing by a factor of three. The weight of a mass of one ton is changed by the amount of 0.25 gram under the action of the gravimetric tide. Due to its elastic properties the Earth deforms and the ground can move 50cm up during the tidal maximum.
The tidal waves regroup in three families which differ by their periodicity (long-period, diurnal or semi-diurnal) and their repartition at the surface of the Earth (zonal, tesseral or sectorial):
- The long-period or zonal waves are changing the moment of inertia of the Earth around its polar axis and are slightly modulating the length of day. The principal lunar wave called Mf has a period of 13.66 days and the corresponding solar wave Ssa a period of 182.621 days;
- The diurnal or tesseral waves are producing a torque which tends to tilt the equatorial plane towards the ecliptic and generates the precession and the nutations of the axis of rotation of the Earth in space. The principal luni-solar wave called K1 (23.93h) is escorted by O1 (25.82h) for the Moon and P1 (24.07h) for the Sun;
- The semi-diurnal or sectorial waves are producing an equatorial bulge which is slowing down the rotation of the Earth and increases the length of the day. The principal waves are called M2 (12.42h) for the Moon and S2 (12h) for the Sun.
At the Belgian coast the semi-diurnal waves are largely dominant. It explains why high tide is delayed by 50 minutes a day.
Topic 3 – Measurements
The astronomical tidal forces are directly modifying the amplitude and the direction of the gravity vector g. The changes of amplitude or gravity variations are recorded by means of gravity meters. The gravimetric tidal forces have a relative magnitude of 0.25×10⁻⁶g. Until the beginning of 1970s the most sensitive instruments were measuring the length variation of a spring to which a mass submitted to the gravity variations is attached. They reached a precision of one part per billion (10-9g) and a long term stability of 10-6g. To reach such a precision it is necessary to stabilize the temperature of the gravimeter within one hundredth of a degree. Nowadays the superconducting gravimeters, using the levitation of a superconducting sphere in the electromagnetic field produced by two superconducting coils, reach a thousand times better precision and stability.
The changes of direction of the gravity vector are called inclinations of the vertical. They are recorded by means of pendulums (3a) or water level clinometers. The Verbaandert-Melchior pendulums have a resolution of 0.0001” and the amplitude of the clinometric tide reach 0.050”. The best water level clinometers reach a resolution one hundred times better.
Tidal forces deform the elastic Earth. The vertical (≤ 50cm) and horizontal (≤ 10cm) ground displacements are directly measured by space geodetic techniques. In contrast the relative distance variations between two neighboring points of the Earth’s crust are only of the order of 0.05 part per million (5.10-8) of the length, i.e. 1µm for 20m. These variations are measured by means of extensometers on a baseline of some 10m long with a precision of 0.1%. Vertically the distance variations reach 0.2µm between two points 3.5m apart.
The two last types of instrument require protection from temperature variations. They are installed in underground galleries at 100m from the entrance and under a rock cover of at least 50m.
Topic 4 – Ocean tides
 Ocean tides produce gravity variations due to the attraction of the moving water masses on one side and to the flexion of the Earth’s crust under the load on the other. This effect can be large. For example the tip of Cornwall is moving 10 cm up and down twice a day. As ocean and Earth tides effects superimpose each other in the gravity signal it is necessary to compute numerically the oceanic effects from the cotidal maps. A first reliable ocean tides model was developed in 1979 by Ernst W. Schwiderski. Ten years later satellite altimetry made it possible to obtain ocean tides models with a few centimeters precision.
Topic 5 – Theoretical models
Thanks to an innovative metrological approach developed by Michel van Ruymbeke it was shown that the scale factor of the wave O1 had to be reduced by 1%.
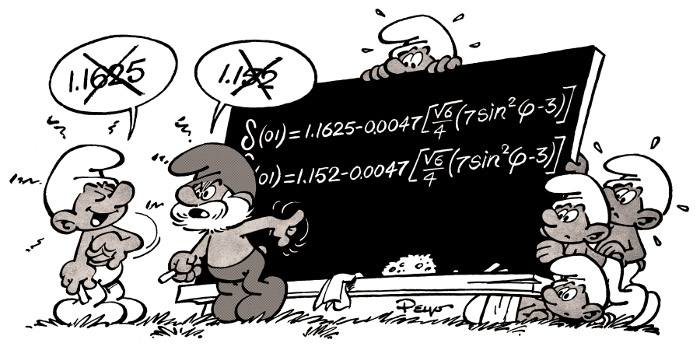
On this ground Paul Melchior demonstrated that the mean values of the tidal factors corrected from ocean tides effects were in excellent agreement with the predictions of the models. For the first time the goal of measuring the response of the Earth to tidal forces with a 0.1% precision was achieved so as to allow comparison with the different theoretical models.

Topic 6 – Worldwide network
In 1970 John T. Kuo from the Lamont Doherty Geological Observatory (New York) spent part of his sabbatical year at the Royal Observatory of Belgium (ROB). A new era is beginning for Paul Melchior’s team. He was indeed bringing with him three gravimeters of new generation much more precise and very easy to install. It was opening new perspectives: the realization of a worldwide network (TWP) of temporary stations where the tidal parameters will be measured with one per cent accuracy. As no reliable tidal model for the world ocean was existing at that time, it was not yet possible to correctly model the ocean tides indirect effects, which are superimposed on the gravimetric tide and prevent to determine the Earth response. A first global model will be published by Ernst W. Schwiderski, on behalf of the US Naval Surface Weapons Center (Dahlgren, Virginia). It is only at that moment that we were able to use around one hundred TWP stations to validate this new model.
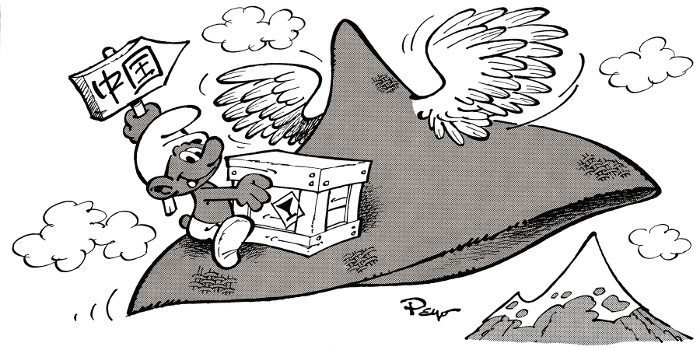
Between 1970 and 1974 some twenty stations were installed throughout Europe with the instrumentation brought by John T. Kuo. In the meantime our group trained itself and prepared the TWP. For that project ROB developed standardized equipment including, besides the gravimeter (6.a, 6.b) and its control unit, a potentiometric recorder and a quartz clock. Taking into account the auxiliary material such as transformer or voltage stabilizer, you reach easily some one hundred kilograms of instrumentation to transport. The choice of the stations was critical. It was necessary to install the instruments in a cellar or at least in a quiet location at the ground floor, where temperature variations were as weak as possible. We carried at least two gravimeters to maximize returns of a mission. The ROB scientist was mostly travelling alone. Considering one week to install the gravimeter and train the local persons in charge, one mission required a three weeks trip. Taking into account 6 months recording at the station, we get the rhythm of two missions per year. We were able to install up to 8 gravimeters simultaneously thanks to the implication of many scientists. They are following intervention order Paul Melchior, Bernard Ducarme, Michel van Ruymbeke, Christian Poitevin, Jean Rasson et Nicolas d’Oreye de Lantremange. That is how 142 tidal gravimetric stations (6.c) were installed between 1973 and 1992.


Topic 7 – Books and publications
The publication of a “Bulletin d’Information des Marées Terrestres (BIM)” was launched by Paul Melchior at the very beginning of his activity to facilitate the exchange of scientific results inside the Earth Tide community. To date, 150 issues of BIM have been published, namely more than 12,000 pages of scientific papers dealing with the different aspects of tidal research.
During some twenty years Anne-Marie Bary, Paul Melchior’s wife, translated the papers written in Russian by our colleagues from Eastern countries very active in our field of research.

Moreover “The Tides of the Planet Earth”, a treatise on Earth Tides written by Paul Melchior, will remain a major publication in the field. This fundamental text, which addresses all the aspects of the problem, was and remains to date a “bible” for generations of researchers.

Topic 8 – Doppler station
The last decade of the twentieth century saw two major breakthroughs in Earth tides studies. Space Geodesy, which allows to locate a point at the surface of the Earth, increased its precision from 50 cm in the years seventies (TraNet network) to a few centimetres only at the end of the century (GPS network). Already in 1972 the US Navy decided to install a Doppler station of the TraNet network at ROB.
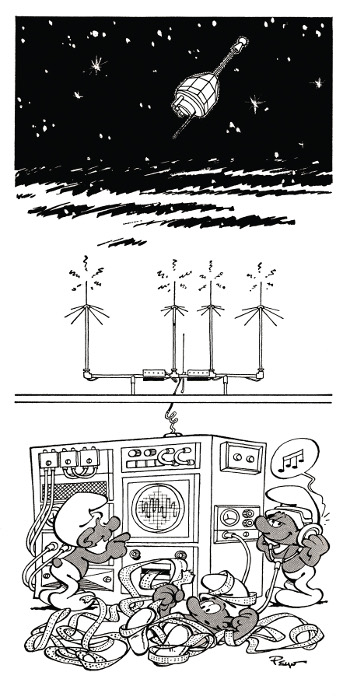
This station, managed by Paul Pâquet, remained operational until 1996 but meanwhile the ROB had already started the observation of the satellites belonging to the GPS network.
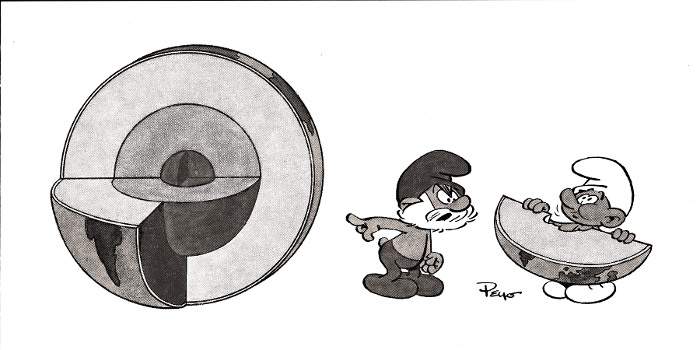
Topic 9 – Supraconducting gravimeter and liquid core of the Earth
As soon as 1968 Prothero and Goodkind from the University of California succeeded to keep in levitation a superconducting sphere of 2.54cm in diameter. Some metals become superconducting at a temperature close to the absolute zero (-273.15°C). Below a critical temperature (7.19°K for lead) the electrical resistivity drops suddenly to zero and an electrical current can flow permanently in a coil. A perfectly stable electromagnetic flux becomes available to produce the levitation of the sphere (9.d). To reach so low temperatures you only have to dip the instrument in a bath of liquid helium at a temperature of 4.2°K. The inner part of the gravimeter is temperature-controlled at the microkelvin level (1µK = 10-6 K) around 4.5K. The first SUPRA arrived at the ROB in 1981. The steady evaporation of the liquid helium stored in a 200 litres tank (Dewar vessel, 9.b) kept the instrument at a very low temperature to maintain the superconducting properties. Helium gas escaped through a radiation maze, which cooled down, reducing strongly the evaporation rate. To compensate for losses, it was necessary to fill up the Dewar every three weeks.

This supra remained operational until year 2000, but since 1995 a SUPRA of a new generation has been installed in the underground station of Membach, where it is still recording. It belongs to a worldwide network of stations exchanging their data. The creation of a worldwide network of superconducting gravimeters (9.c) allowed to measure gravity variations at the nanogal (10-12 g) level.
Thanks to these technological advances it became possible to measure the resonance effect of the liquid core of the Earth inside the tidal spectrum, in agreement at the 0.1% level with the theoretical models developed at the ROB by Véronique Dehant.
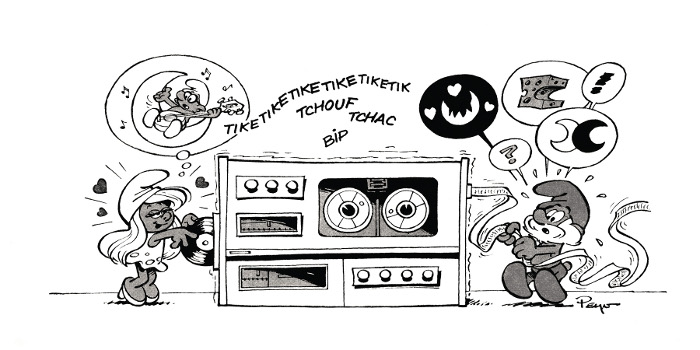
Topic 10 – “Environmental Data Acquisition System” (EDAS)
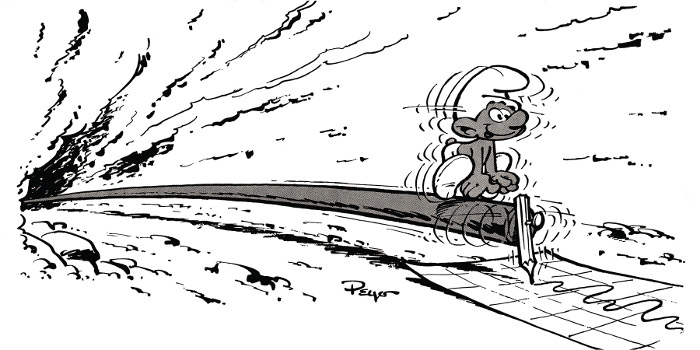
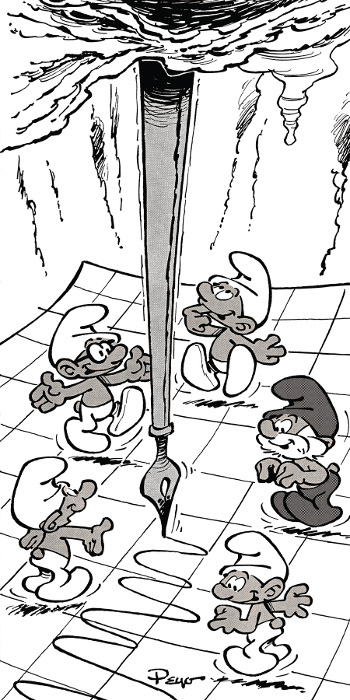
It was only at the beginning of the years 1990’s that the digital data acquisition system EDAS (Environmental Data Acquisition System) became of widespread use. In the past, during the Trans World Profiles (TWP), the use of chart strip recorders was the only recording procedure. The position of the curve with respect to the edge of the paper was measured at the level of the time marks to get the value of the signal as a function of time. The data points were measured with the help of a semi-automatic device producing a Voltage proportional to the displacement of the pointing microscope. A sequence of hourly values expressed in mm was available, expressing the successive positions of the recorder’s pen and thus the displacements of the mass of the gravimeter in response to the variations of gravity. Afterwards these values were multiplied by a calibration coefficient expressed in µgal/cm or nms-2/mm. A numerical data processing was applied to separate the main tidal waves (Q1, O1, P1, K1, N2, M2, S2) through harmonic analysis, in order to compare them directly with the astronomical model.
The ocean tides model of E. W. Schwiderski allowed the computation of the oceanic attraction and loading effects by means of the W. E. Farrell procedure.
Around 1980 Paul Melchior started to develop a data bank within the International Centre for Earth Tides (ICET, topic 11). His goal was to collect all around the world the available gravity tides observations. At the beginning of the nineties the data bank included the tidal parameters of 352 stations and about half of the collected observations belonged to the TEP/TWP (topic 6). A first problem was to insure the homogeneity of the results by checking carefully the applied calibrations. It was quickly noticed that an error on the parameters of the base station of the TWP (Brussels) could be suspected (Topic 5).
Topic 11 – The “International Centre for Earth Tides” (ICET) anniversary

Paul Melchior took advantage of the momentum of international cooperation generated by the International Geophysical Year (1957-58). An international program for the study of Earth Tides is launched in the frame of the “Special Committee for the International Geophysical Year, group XIII (Gravimetry), Commission for the Study of Earth Tides”. As soon as 1956 a “Bulletin d’Information des Marées Terrestres (BIM)” is published at the Royal Observatory of Belgium (ROB) and in 1958 a permanent structure is created at the ROB under the name of “International Center for Earth Tides” (ICET). We celebrate this year the sixtieth anniversary of the creation of this Service depending from the “International Association of Geodesy”. It will stay at the ROB until 2008 and will be intimately associated with the activities of the section “Earth tides – Gravimetry” of this Institute.
![]()